Equipment Monitoring and Predictive Maintenance Using Apache Spark
DeviceHive + Apache Zeppelin
Introduction
Modern device data collection and analytics allow us to take industrial predictive maintenance to the next level. By attaching sensors to equipment and streaming sensor readings into a data platform we can capture equipment’s operational metrics. We can store those metrics in time-series database, research for indicators that would help us predict equipment failure, and eventually use that prediction model on live data coming from production equipment. With DeviceHive device management platform and Apache Zeppelin running on top of Apache Spark we can cover all of abovementioned steps. With one set of tools we can build a solution that scales for tens and hundreds of devices to tens and hundreds of thousand.
Case Study Setup
For the purposes of this case study let’s take a simple desktop fan and use it to simulate an industrial equipment we would like to monitor. We will attach an accelerometer sensor to it and will capture it’s accelerations on all three axis. Using this accelerometer we’ll try to detect equipment malfunction. Since it’s a fan, we’ll define malfunction as an increased vibration of a fan and try to capture that in our data platform. In our experiments we’ll be causing increased vibration by attaching a piece of duct tape to one of the blades, sending the rotor off balance.
For an accelerometer sensor, let’s take Texas Instruments SensorTag, which is capable of sending its readings 10 times a second over Bluetooth Low Energy link (BLE). Our sensor has only BLE and we need to connect it to the data platform. For that we’ll be using a Linux-based gateway device. For the purpose of this case study we can take Raspberry Pi 2 (RPi2), or BeagleBone Black (BBB). This gateway device will be receiving accelerometer data from SensorTag over BLE and sending it to DeviceHive device management platform. After receiving sensor readings from a gateway, DeviceHive will stream those readings into Apache Kafka message bus.
Raw Data Exploratory Analysis
For the purpose of data exploration, we’ll run our test rig for a while turning fan on and off, as well as causing it to vibrate by attaching a piece of a duct tape to it. After that we’ll retrieve the results from a message bus and see what the profile looks like for each axis.

val allData = sc.textFile(s"/mnt/sensordata/sensordata_02APR2015.csv")
val fanData = allData.filter(l => l.contains("handle\\\":48")).cache()
fanData.take(50).mkString("\n")
First of all, instead of three axis, it is safe to use euclidian distance, and reduce it to one measure. For further development let’s save data in the tuple format - notification timestamp & distance:
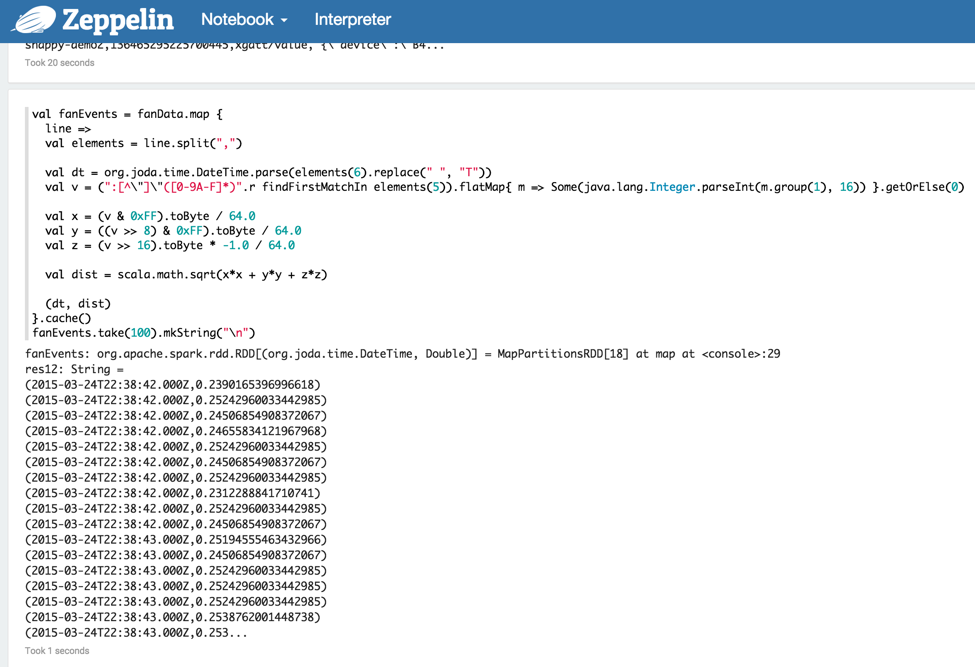
val fanEvents = fanData.map {
line =>  val elements = line.split(",")
val dt = org.joda.time.DateTime.parse(elements(6).replace(" ", "T"))
val v = (":[^\"]\"([0-9A-F]*)".r findFirstMatchIn elements(5)).flatMap{ m => Some(java.lang.Integer.parseInt(m.group(1), 16)) }.getOrElse(0)
val x = (v & 0xFF).toByte / 64.0
val y = ((v >> 8) & 0xFF).toByte / 64.0
val z = (v >> 16).toByte * -1.0 / 64.0
val dist = scala.math.sqrt(x*x + y*y + z*z)
(dt, dist)
}.cache()
fanEvents.take(100).mkString("\n")
How do we reliably spot the vibration? Instead of absolute measure, let’s use variance, and see if we can spot it better:
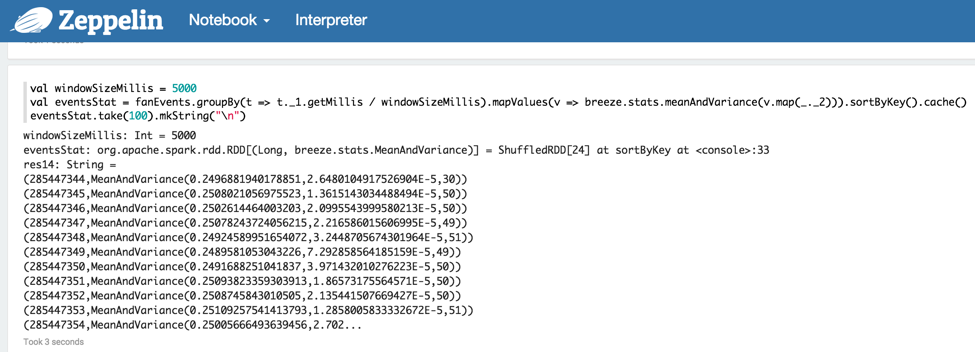
val windowSizeMillis = 5000
val eventsStat = fanEvents.groupBy(t => t._1.getMillis / windowSizeMillis).mapValues(v => breeze.stats.meanAndVariance(v.map(_._2))).sortByKey().cache()
eventsStat.take(100).mkString("\n")
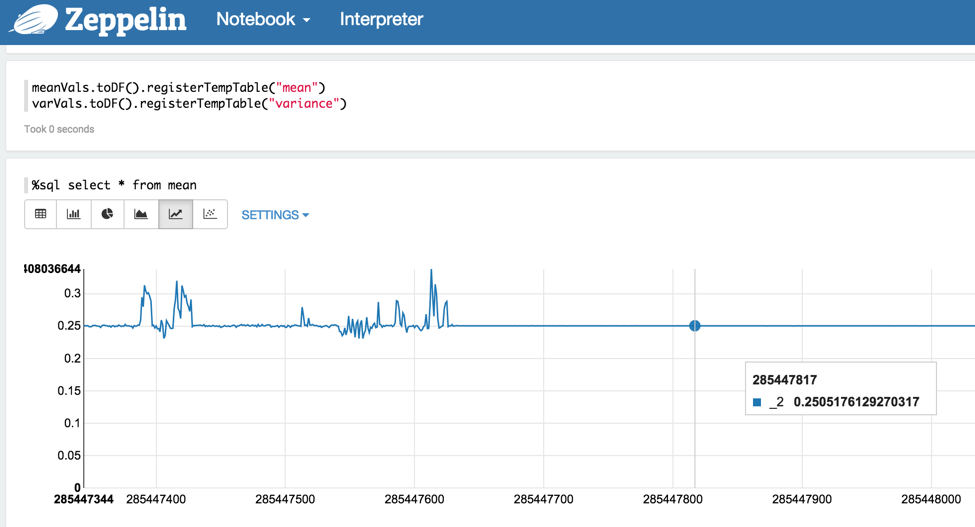
val meanVals = eventsStat.mapValues(v => v.mean)
val varVals = eventsStat.mapValues(v => v.variance)
meanVals.toDF().registerTempTable("mean")
varVals.toDF().registerTempTable("variance")
%sql select * from mean
%sql select * from variance
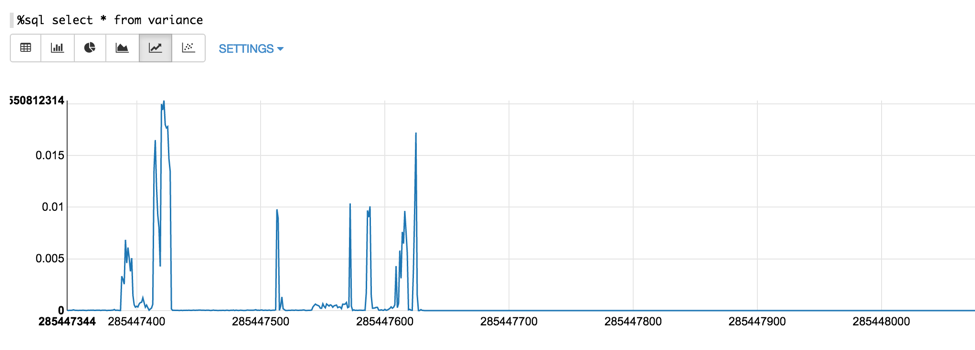
Indeed, one can clearly see that the variance goes up once the fan started to vibrate.
Implementing a Live Stream
With model defined and the threshold set we can now run our model on live data stream using Spark Streaming, which uses the same concepts as Spark. First of all we need to add third-party libraries for JSON parsing and Kafka streaming job:

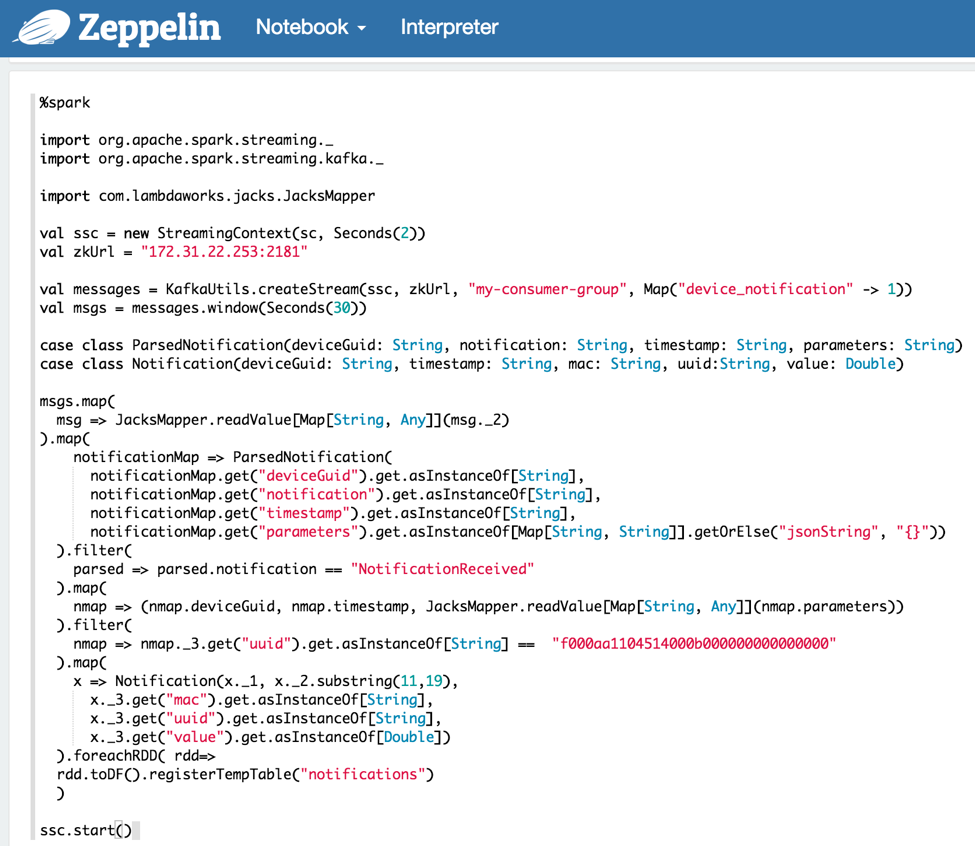
After that we can create our Spark Streaming job in a new note. Some technical explanation:
● To read messages we should create a new KafkaStream. In configs Zookeeper address should be provided
● First map parses input text notification to an object of ParsedNotification class
● Then we should filter all data by the specific name of the notification
● Second filter is needed to get notifications with provided uuid, which contains variance value
● Then each RDD should be transformed to DataFrame (DF) and registered as Spark SQL temp table
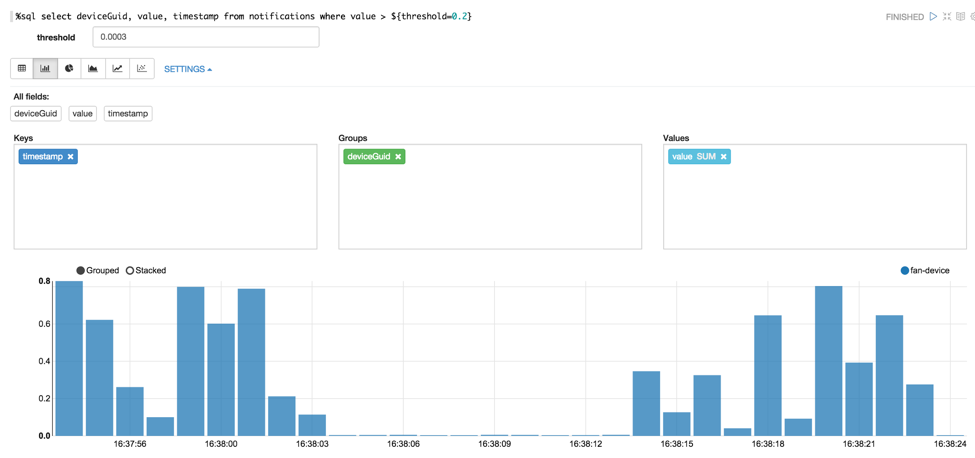
● With ssc.start() we launch our streaming job and can visualise notification values with the help of %sql directive
import org.apache.spark.streaming._
import org.apache.spark.streaming.kafka._
import com.lambdaworks.jacks.JacksMapper

val ssc = new StreamingContext(sc, Seconds(2))
val zkUrl = "172.31.22.253:2181"
val messages = KafkaUtils.createStream(ssc, zkUrl, "my-consumer-group", Map("device_notification" -> 1))
val msgs = messages.window(Seconds(30))

case class ParsedNotification(deviceGuid: String, notification: String, timestamp: String, parameters: String)
case class Notification(deviceGuid: String, timestamp: String, mac: String, uuid:String, value: Double)

msgs.map(
  msg => JacksMapper.readValue[Map[String, Any]](msg._2)
).map(
    notificationMap => ParsedNotification(
      notificationMap.get("deviceGuid").get.asInstanceOf[String],
      notificationMap.get("notification").get.asInstanceOf[String],
      notificationMap.get("timestamp").get.asInstanceOf[String],
      notificationMap.get("parameters").get.asInstanceOf[Map[String, String]].getOrElse("jsonString", "{}"))
  ).filter(
    parsed => parsed.notification == "NotificationReceived"
  ).map(
    nmap => (nmap.deviceGuid, nmap.timestamp, JacksMapper.readValue[Map[String, Any]](nmap.parameters))
  ).filter(
    nmap => nmap._3.get("uuid").get.asInstanceOf[String] ==  "f000aa1104514000b000000000000000"
  ).map(
    x => Notification(x._1, x._2.substring(11,19),
      x._3.get("mac").get.asInstanceOf[String],
      x._3.get("uuid").get.asInstanceOf[String],
      x._3.get("value").get.asInstanceOf[Double])
  ).foreachRDD( rdd=>
  rdd.toDF().registerTempTable("notifications")
  )
ssc.start()
%sql select deviceGuid, value, timestamp from notifications where value > ${threshold=0.2}
Conslusion
This case study shows that DeviceHive and Spark can be essential tools for capturing and exploring device data that can lead to building predictive maintenance models and using them at scale in production environment. DeviceHive gives you tools to quickly capture your equipment’s operational parameters and stream them into a data platform. Apache Spark and Apache Zeppelin provide means for data exploration, prototyping and visualization. This will help you to build a reliable model for predictive maintenance. Using Apache Spark you can use the same model for your live data in production environment being able to scale to hundreds of thousands of devices.
Updated less than a minute ago
